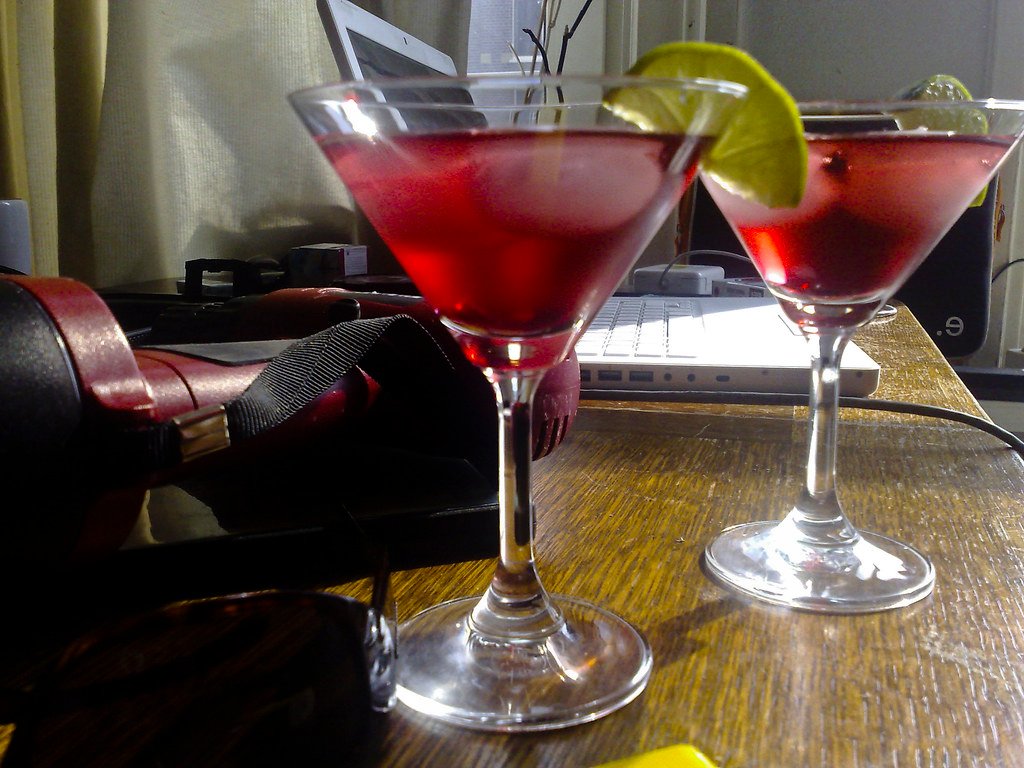
In a dramatic shift, the non-alcoholic segment of the adult beverage market in the United States is experiencing an unprecedented boom. Fresh data released by Nielsen IQ reveals a staggering 31% surge in total dollar sales of non-alcoholic beer, wine, and spirits at off-premise locations, such as grocery stores, over the past year, with sales now hitting a remarkable $510 million. This seismic growth is attributed to an increasing number of Americans prioritizing wellness and moderation in their drinking habits.
A Sobering Trend on the Rise
Non-alcoholic beverage sales traditionally see a surge during the first month of the year, thanks to Dry January, a time when many drinkers take a break from alcohol. However, the latest findings indicate that non-alcoholic drinks have become a year-round staple, making their mark during all major drinking holidays, including the 4th of July and year-end celebrations.
What’s particularly interesting is that the overwhelming majority of consumers purchasing non-alcoholic products also buy alcoholic beverages. Nielsen IQ’s analysis shows that over 94% of non-alcohol buyers are simultaneously purchasing alcohol-containing beer, wine, and spirits. This trend highlights the deep engagement of these consumers with beverage alcohol, adding significant value to the total alcohol industry.
A Nationwide Phenomenon
The surge in non-alcoholic adult beverage sales is not limited to specific regions; it’s a nationwide phenomenon. In all nine regions of the U.S. covered by the study, non-alcoholic adult beverage sales have experienced double-digit growth in terms of dollar amount spent over the past year. However, it’s worth noting that five states stand out, accounting for a significant 30% of the total sales amount.
Leading the pack is California, with an impressive $85.7 million in sales, followed by Colorado ($19.2 million), Massachusetts ($18 million), Michigan ($15.1 million), and Ohio ($15 million). Notably, Michigan saw an outstanding 37.7% increase in non-alcoholic beverage sales, while Ohio witnessed a staggering 44.8% surge.
The Dominance of Non-Alcoholic Beer
Within the non-alcoholic beverage sector, non-alcoholic beer reigns supreme, commanding a remarkable 86.1% of the market share. Following closely behind is non-alcoholic wine, accounting for 11.2%. Alcohol-free spirits, though a smaller player at 2.7%, have seen an astonishing 94% increase in sales compared to a year ago, primarily driven by the popularity of non-alcoholic vodka, which has skyrocketed by 528.1%.
From Shelves to Bars: A Shift in Preferences
Consumers are not merely limiting their non-alcoholic beverage purchases to off-premise locations. There’s a notable shift towards choosing booze-free options at bars and restaurants. Surprisingly, approximately 1 in 7 patrons at on-premise establishments opt for non-alcoholic alternatives, and this number rises to an impressive 25% among customers under the age of 35. Even more intriguing, almost half of non-alcoholic drinkers still enjoy both alcoholic and non-alcoholic beverages when patronizing on-premise serving spots.
Taste and Togetherness Drive the Trend
When asked about their primary reasons for purchasing non-alcoholic beverages, consumers had two clear answers. The top factor cited was a genuine appreciation for the flavor of these drinks. Following closely behind was a desire to share in the experience of drinking with others, emphasizing the social and inclusive aspect of this evolving trend.
The landscape of the beverage industry is undergoing a remarkable transformation, with non-alcoholic alternatives taking center stage. As more Americans seek a balance between indulgence and well-being, the non-alcoholic revolution shows no signs of slowing down, promising a flavorful and inclusive future for beverage enthusiasts across the nation.
Download our app MadbuMax on the Apple App Store for the latest news and financial tools. Interested in getting your finances in order do not forget to check Dr. Paul Etienne’s best-seller book on personal finance. To access more resources, tools, and services please click here. Also, do not forget to follow Dr. Etienne on IG or Twitter.


